ITCHS Home HQN Contents Permissions
HQN
The Humor Quotient Newsletter
Vol. 11, No. 2 June 2009 Winona, MN
Humor for Elder-Care Professional Specializations, Preliminary Differences
In HQN Vol. 11 no. 1, we began reporting on an assessment of 241 Minnesota elder-care professionals as part of a humor session at the Aging Service of Minnesota Institute in February 2009. That first report focused on participant responses to nine humor attitude queries. Response patterns were quite uniform; that is to say, if one respondent’s answers consecutively coded as1, 3, 3, 1, it was typical that the next coded as 2, 4, 4, 2 and almost never that it was anything like 4, 2, 2, 4.
From this analysis and other interactional feedback during the session, we concluded that
1) humor is already an accepted initiative in Minnesota’s elder-care industry with wide-ranging experimentation,
2) that there are remarkably consistent attitudes about humor among Minnesota practitioners in elder care across widely-divergent occupational specializations, and
3) that the general humor attitude of such professionals is positive, unjaundiced, and hopeful for increased use and efficacy of humor in elder-care situations.
1
The Institute for Travesty, Comedy, and Humor Studies (ITCHS) has also developed part of its website under the title Humor and Aging to report directly to the elder-care professional community. Preliminary differences in humor among elder-care professional specializations was first reported there. .
The very large database of this assessment is taking considerable time to record and analyze As a first trial-run of computer programming for these reports, 15 responses apiece were randomly chosen representing elder-care specializations of Social Work, Activities and Recreation, Residential Nursing, and Home Nursing. All chosen representatives held Bachelor’s or higher degrees. A total of five chaplain-pastor responses were received, and these were also included in the pilot study, for a total of 65 responses..
All respondents had taken the cartoon half of the Humor Quotient Test (HQT), yielding four subscores for four types of mental humor: Gotcha, Sympathetic Pain, Incongruity, and Word Play. (For definitions of these, see The Humor Quotient Test, A Quick Summary. For full length discussions of these forms in modern American cinematic comedy, see Chapter 3 of Comedic Tenor, Comic Vehicle).
For each of the four humor subscores, each participant’s score was ranked against all other participant scores, a rank of 1 indicating the lowest, and a rank of 65 indicating the highest preference. Participant scores were then grouped by occupational specialization. Group total rank scores were then used in a Wilcoxon-Mann-Whitney calculation of statistical significance.
The table below displays rank total scores for each of the five specialization groups for each of the four mental humor types. It must be kept in mind that the first four groups have 15 representatives apiece while Chaplain-pastors are represented by only five.
2
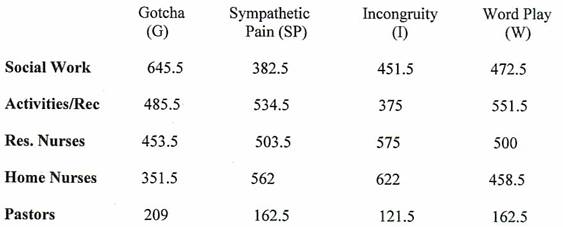
Table 1: Rank Totals by Occupational Group for Four Humor Types
The two highest rank totals shown in this table are Social Worker Gotcha (645.5) and Home Nurses Incongruity (622). It must be recognized however that Pastors Gotcha (209) represents only a third as many entries. The two lowest rank totals were Home Nurses Gotcha (351.5) and Activities/Rec Incongruity (375). Again Pastors Incongruity (121.5) is impressively low given that it represents only a third as many individual scores.
At a 95% confidence or better as measured by the Wilcoxon-Mann-Whitney Ranks Test, then:
· Social Workers have a higher preference than the other groups for Gotcha;
· Social Workers have a lower preference for Sympathetic Pain;
· Activities/Rec personnel have a lower preference for Incongruity;
· Home Nurses have a higher preference for Incongruity;
· Home Nurses have a lower preference for Gotcha.
3
Different professional subgroups show different humor preferences. There then seems to be either a natural sorting of humor preferences into different occupational categories within the same industry or a biasing of humor preference by one’s occupational experience within the same industry. Either way, the social adaptation involved needs additional study, and quite possibly certain tensions between practitioner groups of the industry may be somewhat elucidated by differences in humor preference.
Separately, Table 1 comes close to 95% confidence of overall oddity. For each occupational category, we can establish a high and low rank score: for example Social Workers are highest in Gotcha (645.4) and lowest in Sympathetic Pain (382.5).
For four of five occupational categories, Gotcha is either a highest or lowest rank total score. For four of five occupational groups, Incongruity is also either a highest or lowest rank total score. Only Social Work Sympathetic Pain (lowest) and Activities /Rec Word Play (highest) violate this general pattern This odd clustering falls just short at 94.5% confidence of some real, rather than merely statistical, explanation for Gotcha and Incongruity to be extremes for these industry occupational specializations. Further study of this oddity seems warranted, and conclusions about it are obviously premature. Perhaps a clue in this area is provided by Incongruity’s low preference for the industry as a whole as reported below and/or by its relationship to positive humor attitudes in the elder-care industry (to be further discussed in the next issue of HQN.)
First Full-set Statistical Results, Aging Service of MN, February 2009
As noted earlier, humor session participants were given the cartoon half only of the HQT. Average scores have been adjusted to reflect the fact that the cartoon half of the HQT, consisting of 21 pairs of jokes, necessarily had two humor types—Gotcha and Sympathetic Pain—represented 11 times and two represented 10 times.
With a total of 241 usable responses from professionals attending the Aging Service of Minnesota Institute February 2009 conference at the Hyatt Hotel, Minneapolis, we are now able to report the following adjusted average scores for four humor-of-the-mind humor types:
Gotcha 4.81
Sympathetic Pain 5.16
Incongruity 4.71
Word Play 5.32
From these averages, we note that the joke type most preferred among participants was Word Play, with Sympathetic Pain coming in second. As previously reported for Lake Winona Manor, Winona, Minnesota, with a resident population and tested sample comprised of approximately 80% women, test results leaned strongly toward Sympathetic Pain and, secondarily, toward Word Play.
4
In this study we are considering staff, not residents, yet there is a similar preference among humor types, the difference being that staff leans more strongly to Word Play while residents lean more strongly to Sympathetic Pain. These results at least strongly suggest that the work environment in the elder-care industry does favor appreciation for Word Play and Sympathetic Pain humor and that such a bias creates something of a humor bond between staff and residents.
In this context, it should be emphasized that the minority of males tested at Lake Winona Manor did not share the marked Sympathetic Pain-Word Play preference of women respondents. ITCHS has currently entered into an agreement with Missions Nursing Home of Plymouth, Minnesota, an all-male-resident nursing facility in order to further explore such gender differences and their likely meaning. Suffice it to say here that Lake Winona Manor’s predominance of women residents is mirrored in the proportion of women among attendees at the Aging Services of Minnesota Institute and in the general run of nursing homes whose residents are typically very old and thus typically heavily weighted away from men and toward women.
It is well to note that for the Aging Services full-241 data, Gotcha and Incongruity humor are rather distantly trailing in third and fourth place. As reported earlier (HQN 11.1) humor attitudes among conferees at the Hyatt seminar seem little aware of the darker, put-down side of humor and its dangers. This perhaps is congruent with little preference for Gotcha humor among elder-care practitioners.
It is also well to note that Incongruity and Gotcha, the least preferred of the humor types for all 241 conference respondents, are also the two types of humor in which particular occupational specialist groups are most likely to be extreme compared to their average preference score (see Table 1 above).
And Incongruity itself ranks dead last, the lowest preference among our nursing-professional respondents.
We expect to speak at more length to these full-data-set results in subsequent issues. The major finding of this preliminary data is that Sympathetic Pain and Word Play are both higher among nursing-home residents and elder-care staff compared to other data sets that have been considered in previous issues of HQN.
Next month, we intend to consider at more length the special place of Incongruity within the Aging Services full data set.
Paul Grawe
ITCHS
5